Home / Marketplace / Grafana + Prometheus on Ubuntu 24.04 LTS
A monitoring stack in one VM: Grafana 13 pre-wired to a local Prometheus 3. On first boot a unique admin password is generated for your VM and stored in a root-only file — there is no shared default credential anywhere in the image. Dashboards and exporters are yours to add.
ssh <your-username>@<VM-IP>
sudo cat /var/lib/grafana-firstboot-admin-pw
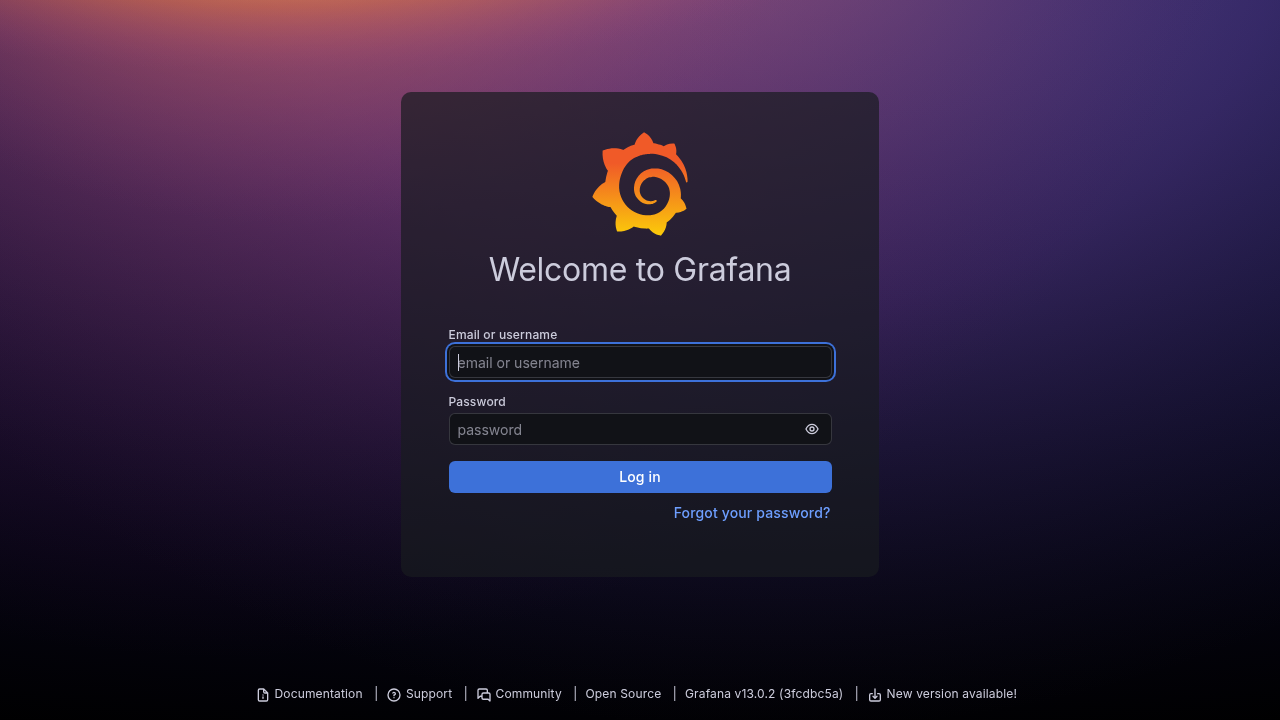
Sign in as admin with the generated password. Image version 2026.915.2216 (published 2026-09-16) is the first build whose first-boot reset reaches Grafana's live database; deploying the offer's default ‘latest’ gives you a build with that fix. On VMs from an earlier image — including a deployment that explicitly pins an older version — the password is rejected, and the manual reset in Troubleshooting is the cure; it works on every image.
Freshly rebuilt against the latest security advisories, no shared default credentials, Trusted Launch support, and automatic OS security updates — everything runs in your own Azure subscription under your governance.
Production-ready, hardened, and maintained. Deploy straight from the Azure Marketplace into your subscription.
 Derek Coleman & Associates Inc